
GE-244896 AI translation check
The Benchmarking tab in GenAI Lens provides you with instant access to how your brand, products, or topics compare to competitors across key visibility metrics in the world of large language models (LLMs)!
This article will cover:
Accessing the Benchmarking Tab in GenAI Lens
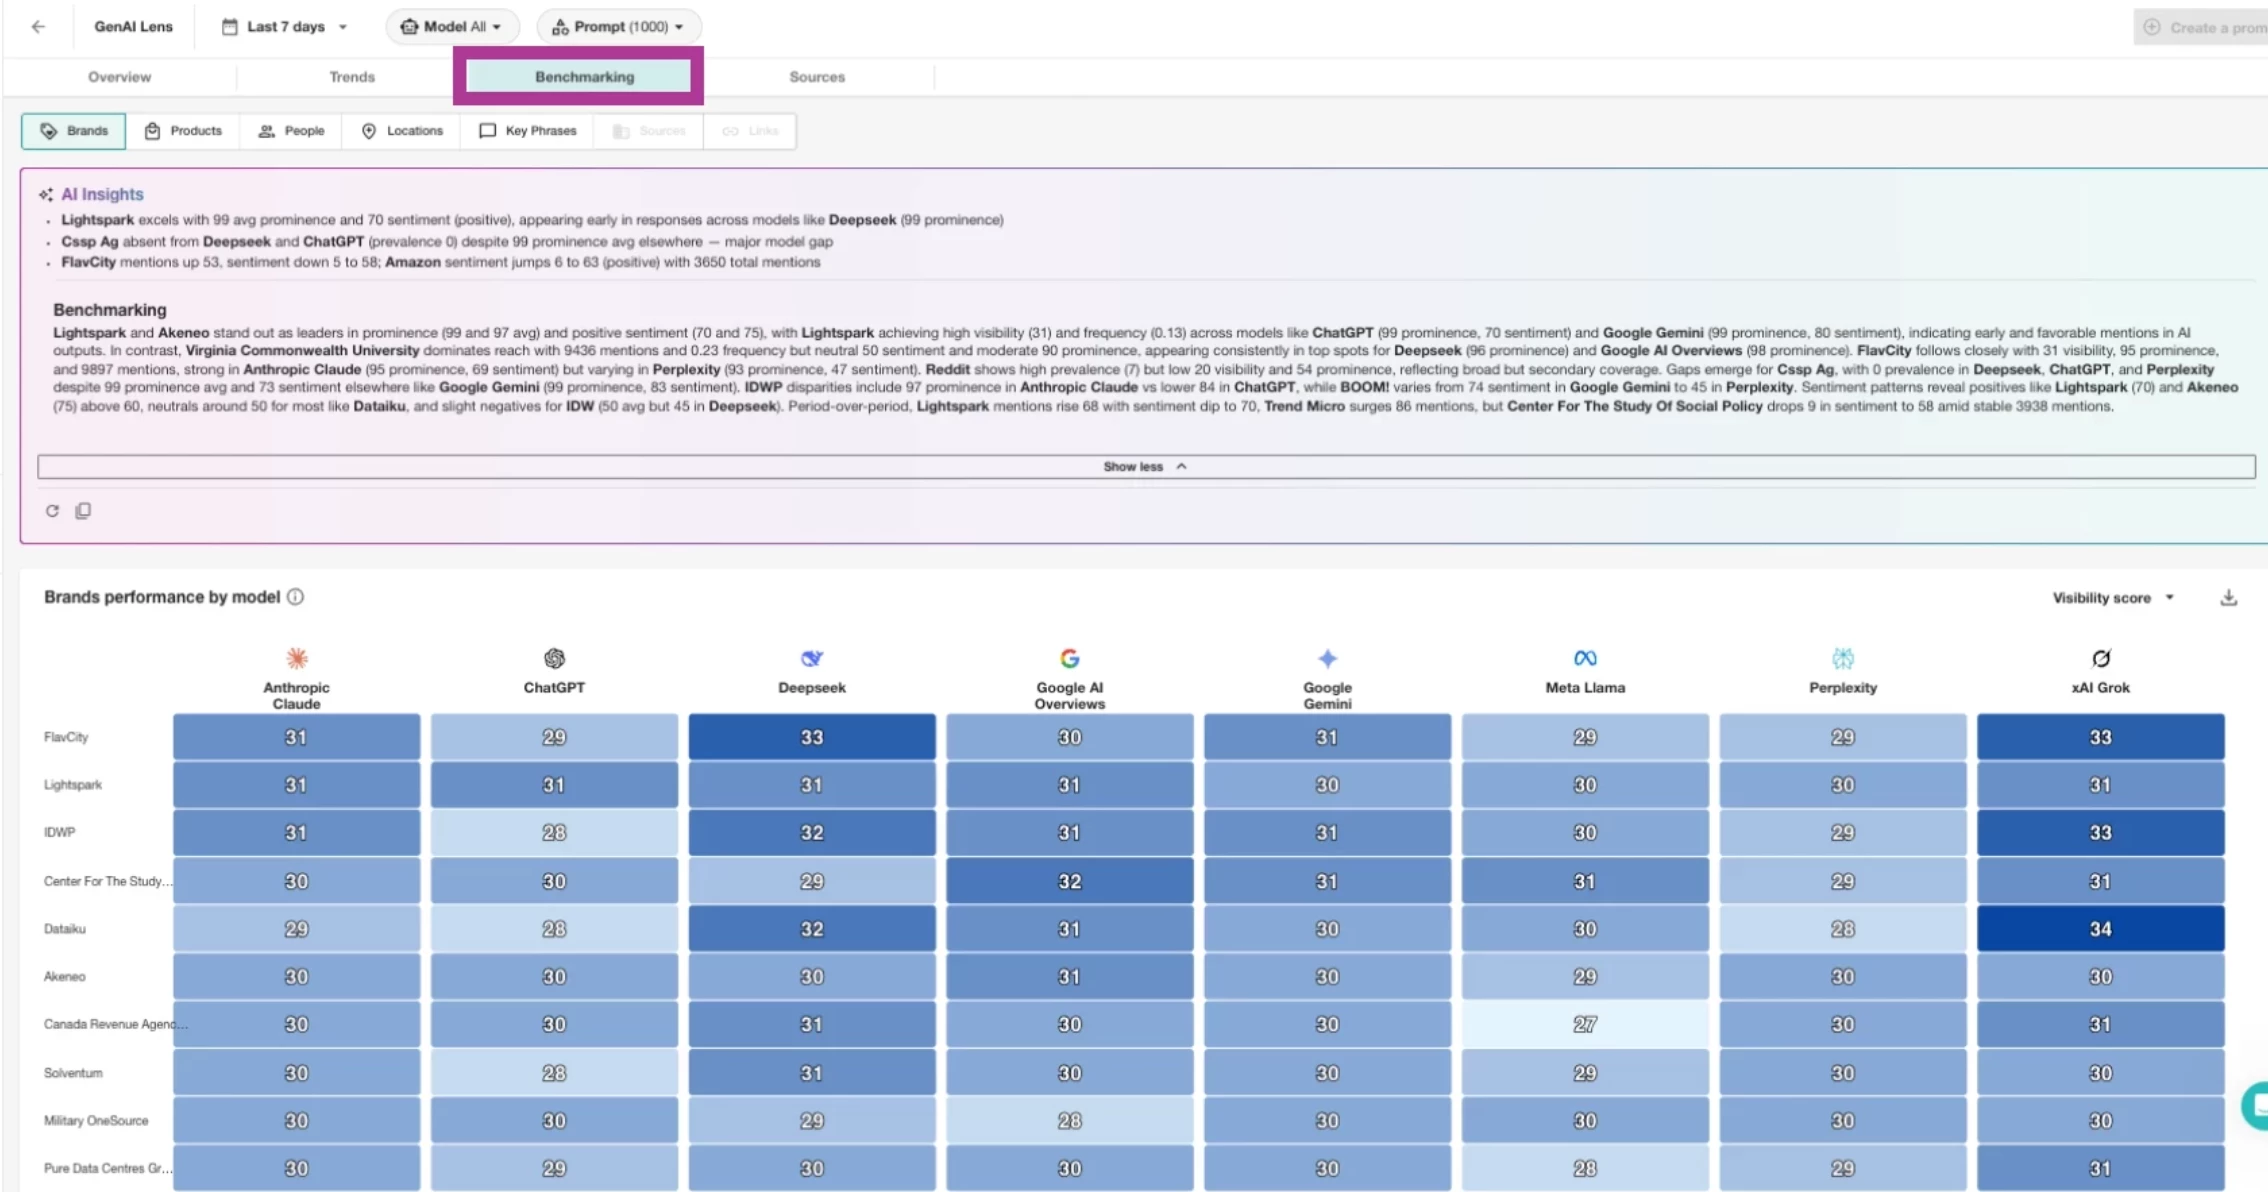
Similar to our other tabs, the data in the Benchmarking tab will begin to populate once prompt creation is completed. Within this tab, we utilize the entities gathered from the LLM responses and compile them into heat maps and ranking widgets. Just like our tabs, we provide AI Insights at the top of the page to summarize the data below.
- Click the Monitor drop-down in the left-hand navigation
- Click GenAI Lens
- Select Benchmarking in the top toolbar
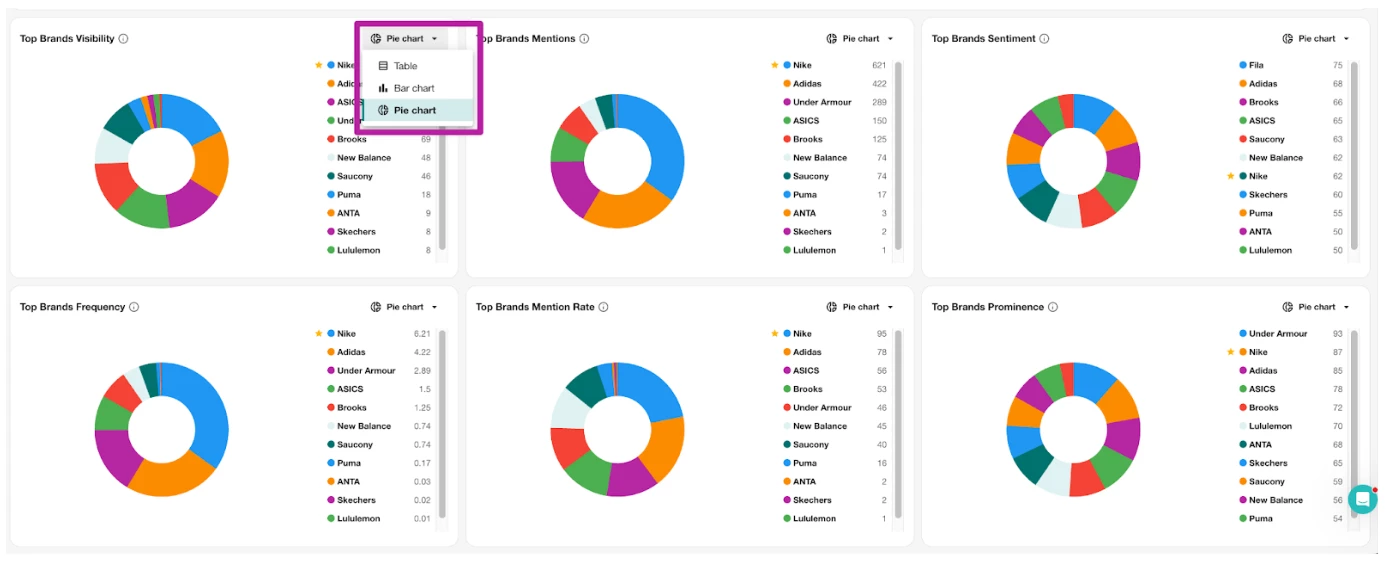
- In any of the below graphs, click the Chart Type drop-down and select between
- Pie Chart
- Bar Chart
- Table
Note:
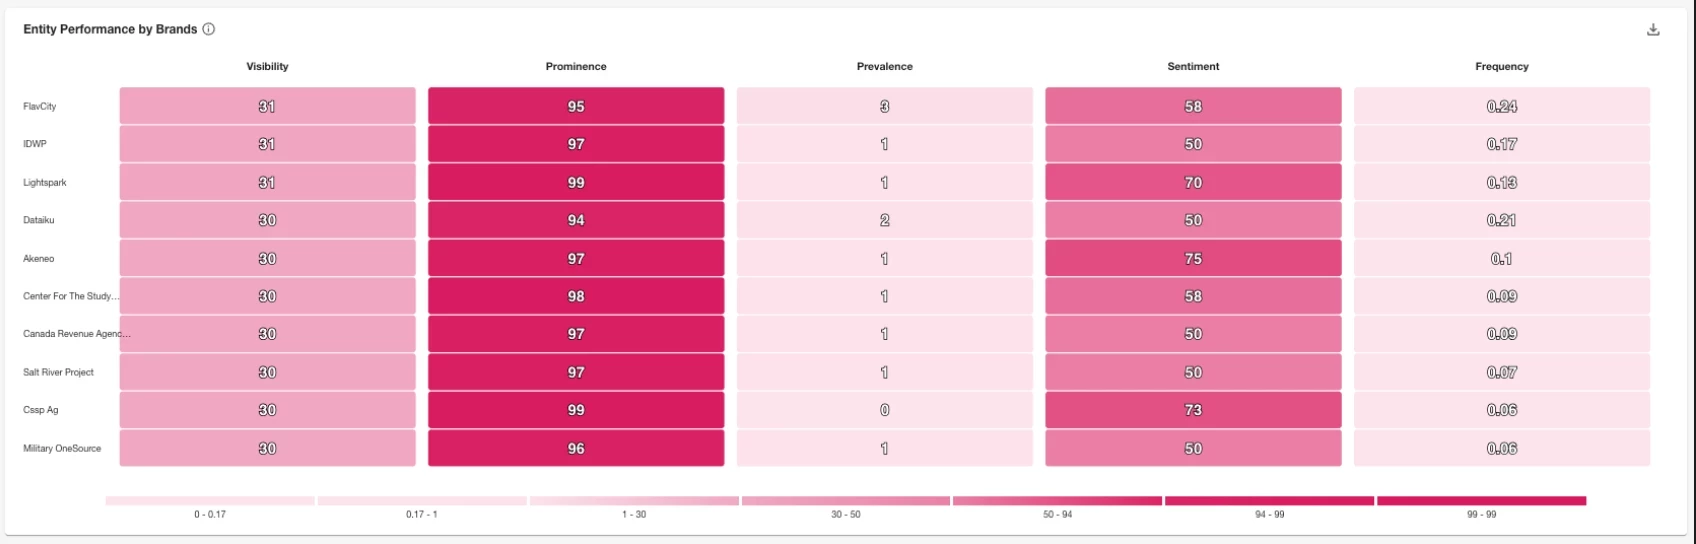
- Most of the heat map data is provided on a scale from 0 - 100.
- When using Total Mentions for the data, it compiles the entity’s total across the various LLMs.
- Sentiment scoring is assigned by a system prompt and uses the LLMs to give a score. The LLMs are giving us Sentiment for the entire result and per entity.
Metric Definitions
Prominence: measures how early an entity appears within a prompt’s response.
Mention/Citation Rate: percentage of results that the entity appeared in.
Frequency: average number of times an entity is mentioned per result within the selected filters and date range.
Visibility: is a combined score that provides a single, balanced measure of an entity’s overall presence. It combines how widely an entity appears (Mention/Citation rate), how often it is mentioned (Frequency), and how central it is to the content (Prominence).
